Performance Monitoring
- 3065 words
- Estimated Reading Time: 15 minutes
I’m big on budgets. Life became much simpler when I embraced having a monthly budget for my personal finances. The concept of a budget can be applied to more than just financial planning. In real-time applications a performance budget helps with wrangling the competing needs of the various subsystems.
Setting a Budget#
I target 60 FPS for my Agent Playground simulation engine. That means each frame has ~16.65 milliseconds (ms) to completely run.
The Agent Playground engine delegates the responsibility of maintaining a stable framerate to the SimLoop class. Let me show you how it does this.
The SimLoop class launches a new Python thread that it uses to run a simulation’s per frame instructions. When the app spins up a new simulation it creates an instance of the SimLoop class and passes in the SimulationContext object that contains the scene data and any per frame data that needs to be passed around.
# Note: Excluding some code for clarity.
class SimLoop
  def __init__(
    self,
    scheduler: TaskScheduler = TaskScheduler(),
    waiter = Waiter()) -> None:
    # I use an instance variable to track the state the simulation is in.
    self._sim_current_state: SimulationState = SimulationState.INITIAL

  def start(self, context: SimulationContext) -> None:
    """Create a thread for updating the simulation."""
    self._sim_thread = threading.Thread(
      name="simulation-loop",
      target=self._sim_loop,
      args=(context,),
      daemon=True
    )
    self._sim_thread.start()
The new thread invokes the sim_loop method listed below. We can think of this
as the “main” function for a simulation. The goal is to have this invoked exactly
60 times per second. Each frame should spend the same amount of time running.
def _sim_loop(self, context: SimulationContext):
  """The thread callback that processes a simulation tick."""
  while self.simulation_state is not SimulationState.ENDED:
    match self.simulation_state:
      case SimulationState.RUNNING:
        self._process_sim_cycle(context)
      case SimulationState.STOPPED | SimulationState.INITIAL:
        # The sim isn't running so don't keep checking it.
        self._wait_until_next_check()
      case _:
        raise Exception(f'SimLoop: Unknown SimulationState {self.simulation_state}')
You can see in the snippet above that the sim_loop method is just handling the orchestration of what to do if the simulation is initializing, running, or stopped. In the case that the simulation is running, the process_sim_cycle method is called.
def _process_sim_cycle(self, context: SimulationContext) -> None:
  """Do the work required for a single tick (i.e. frame) of the simulation."""
  loop_stats = {}
  loop_stats['start_of_cycle'] = TimeUtilities.now()
  time_to_render:TimeInMS = loop_stats['start_of_cycle'] + UPDATE_BUDGET

  # Are there any tasks to run in this cycle? If so, do them.
  self._process_per_frame_tasks()

  # Is there any time until we need to render?
  # If so, then sleep until then.
  self._waiter.wait_until_deadline(time_to_render)
  self._update_render(context.scene)
The process_sim_cycle method is where the performance budget comes into play.
This is my current performance budget.
| Item | Value |
|---|---|
| Target FPS | 60 |
| Target Time Per Frame | 16.667 ms |
| Run Tasks Allocation | 10 ms |
| Render Allocation | 6.667 ms |
This budget reserves ~60% of each frame for running tasks and 40% for rendering. The tasks can be anything. In practice they are agent related activities like navigating, path finding, AI activities, and updating the scene graph.
A more sophisticated engine might organize these activities into separate phases but for my needs this seems to be working ok for the moment.
Tracking the Budget: Allocation vs Utilization#
Creating a budget is just the first step. To get value from the budget I need to be able to see how the actual performance is comparing to the allocations. The reasons for this are two fold.
- If any phase is over its allocation it can cause dropped frames.
- If any phase is significantly under its allocation, then I know I have more headroom for adding more stuff.
To do this, I can take measurements of each phase in a frame and compare how long it took to the allocation. In theory this seems fine. In practice, I find that observing I spent 7.42 milliseconds on running tasks to not be helpful when I’m running a simulation. Rather, I like to keep an eye on the utilization of each phase.
Utilization is simply the amount of how much of the allocation is being used. I like to view it in the form of a percentage.
$$ {\it {\text {Utilization } }} {\bf U}(x) = \cfrac{used(x)}{allocation(x)} * 100 $$
At this point you may be asking: “why don’t you just use a profiler for tracking this?”
That’s a good question. I do use profilers for when I’m trying to answer the questions:
- Why are things slowing down?
- Where is time being spent?
- What exactly is using memory?
I tend to swap tools out fairly regularly. At the moment I’m using py-spy with speedscope for general profiling.
Profilers are great for deep analysis of what the code is doing. They’re not useful for monitoring an application while it’s running.
When I’m developing a simulation I want to be able to quickly see if the simulation is performing well enough. If it isn’t, then I can pull out the profiler.
Off the Shelf Performance Monitoring#
I’m not the first person to want monitor their app while it’s running. There is an entire cottage industry around Application Performance Monitoring(APM). These tools however primarily target monitoring servers in distributed systems and are overkill for my little engine.
The Agent Playground engine uses DearPyGUI
for the UI and graphics. It is a batteries included framework that has a simple
performance monitoring app.
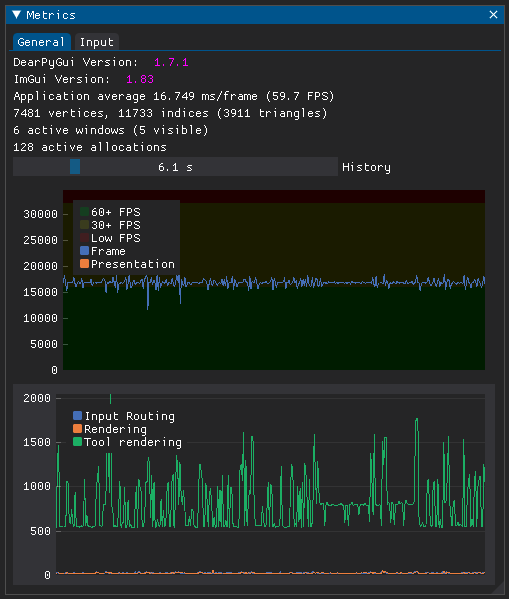
I used the out of the box monitoring app for a while but I wanted more insight. I often found myself having both the macOS Activity Monitor and the DearPyGUI Metrics Window open and frankly just got tired of having to translate in my head what the various metrics mean in the context of my app.
So I decided to write my own.
Defining What I Want#
Before I began building my solution I landed on a few goals.
- A simulation can run in full screen mode so I want the monitoring UI to be visible even if the simulation is taking up the entire screen.
- I want to be able to see frame specific metrics like how much time is being spent on processing tasks and how much of my task allocation is being utilized.
- I want to be able to see how much the simulation is taxing the hardware.
- I want the UI to be updating in real-time.
- I don’t want the performance monitoring to slow down the simulation.
Capturing Per Frame Metrics#
I started with building the easiest part first.
I want a generic way to measure the duration of a function call. To represent this I creatively defined a typed alias called Sample.
Sample = int | float
I want to show a rolling graph of samples over time. Old samples should roll off as new samples are added.
I tried a few different solutions before getting to something I can live with. My first serious attempt was to prepopulate a list with 0s and then create a new list every time I rendered by slicing off the left of the list and appending the new samples to the right. It looked kinda like this snippet.
TOTAL_SAMPLES_LENGTH = 120
SAMPLES_BASE_LINE = 0
old_samples = [SAMPLES_BASE_LINE] * TOTAL_SAMPLES_LENGTH
old_samples = old_samples[len(new_samples):] + new_samples
render(old_samples)
The above approach works, but feels like a hack. I knew that I really wanted a FIFO queue with a fixed length that was filled with a baseline value.
It turns out the deque data structure that Python provides can do this out of the box. The deque data structure makes it easy to store a rolling set of values. You just give it a fixed size and append to the right of the data set. Values on the left will be automatically ejected when the max length is exceeded. I ultimately decided to encapsulate this behavior in a class named Samples.
class Samples:
  def __init__(self, length: int, baseline: float) -> None:
    self.__fifo = deque([baseline]*length, maxlen=length)

  def collect(self, sample: Sample) -> None:
    self.__fifo.append(sample)

  @property
  def samples(self) -> Tuple[Sample, ...]:
    return tuple(self.__fifo)

  @property
  def latest(self) -> Sample:
    return self.__fifo[-1]
I want to take samples of various functions. To organize this, I have the DurationMetricsCollector class. This is responsible for storing the different series of samples.
class DurationMetricsCollector:
  def __init__(self) -> None:
    self.__samples: Dict[str, Samples] = dict()

  def collect(self, metric_name, sample: Sample, count: int) -> None:
    """Collect samples as a series.

    Args:
      - metric_name: The name to record the sample as.
      - Sample: The sample to save.
      - count: How many samples to track. Older samples roll off.
    """
    if metric_name not in self.__samples:
      self.__samples[metric_name] = Samples(count, 0)
    self.__samples[metric_name].collect(sample)

  @property
  def samples(self) -> Dict[str, Samples]:
    return self.__samples

  def clear(self) -> None:
    self.__samples.clear()
To actually take the duration measurements I did the Pythonic thing and created a decorator. This enables wrapping the functions I’m interested in with start and stop times and storing the duration in a centralized instance of the DurationMetricsCollector.
_duration_metrics = DurationMetricsCollector()

def sample_duration(sample_name:str, count:int) -> Callable:
  """ Take a measurement of a function's duration.

  Args:
    - sample_name: The name to record the sample as.
    - count: How many samples to track. Older samples roll off.
  """
  def decorator_sample(func) -> Callable:
    @wraps(func)
    def wrapper_sample(*args, **kargs) -> Any:
      start: TimeInMS = TimeUtilities.now()
      result = func(*args, **kargs)
      end: TimeInMS = TimeUtilities.now()
      duration: TimeInMS = end - start
      _duration_metrics.collect(sample_name, duration, count)
      return result
    return wrapper_sample
  return decorator_sample
Having a decorator for taking the samples enables easily adding a duration measurement to any method. For example, here is how I’m measuring the process_sim_cycle method.
@sample_duration(sample_name='frame-tick', count=FRAME_SAMPLING_SERIES_LENGTH)
def _process_sim_cycle(self, context: SimulationContext) -> None:
  # Doing a bunch of stuff...
At this point, I now have a way to define what a sample is, a method to collect function duration samples, and a way to store them. Now I just need a method to determine when to signal to the UI that there are samples to render.
The challenge here is that frames are going to be collected every frame but I don’t want to notify the GUI each time. That’ll slow the simulation down. Also to further complicate things I want different update frequencies for the per frame metrics and the hardware metrics.
The simplest solution is to just track how many frames have gone by and then check with if statements if a target has been reached.
FRAME_SAMPLES_LIMIT = 10
HARDWARE_SAMPLES_LIMIT = 120

def _sim_loop(self, context: SimulationContext):
  frame_samples_count = 0
  hardware_samples_count = 0
  while self.simulation_state is not SimulationState.ENDED:
    match self.simulation_state:
      case SimulationState.RUNNING:
        self._process_sim_cycle(context)
        frame_samples_count += 1
        hardware_samples_count += 1

        if frame_samples_count >= FRAME_SAMPLES_LIMIT:
          frame_samples_count = 0
          super().notify(SimLoopEvent.UTILITY_SAMPLES_COLLECTED)

        if hardware_samples_count >= HARDWARE_SAMPLES_LIMIT:
          hardware_samples_count = 0
          super().notify(SimLoopEvent.TIME_TO_MONITOR_HARDWARE)
      case SimulationState.STOPPED | SimulationState.INITIAL:
        self._wait_until_next_check()
      case _:
        raise Exception(f'SimLoop: Unknown SimulationState {self.simulation_state}')
That certainly works but conditionals result in logic branching which in turn makes the code more complicated, harder to test, and to my eye, ugly.
The way I decided to handle this was by defining an actionable counter. The idea is a counter can count up or down and take optional actions when specific thresholds are reached. This simplifies the logic for things that are frequency based because I can set a target and simply count up or down on every frame tick. When the threshold is met the counter just fires a callback to notify the UI that there are samples to render.
If we put it all together the frame level metrics collection now looks like this.
class SimLoop
  def __init__(self, scheduler: TaskScheduler = TaskScheduler(), waiter = Waiter()) -> None:
    # Skipping a bunch of initializations...
    # Initializing the counters to control when to notify the UI.
    self._utility_sampler = Counter(
      start = UTILITY_UTILIZATION_WINDOW,
      decrement_step=1,
      min_value = 0,
      min_value_reached=self._utility_samples_collected)

    self.__monitor_hardware_counter = Counter(
      start = HARDWARE_SAMPLING_WINDOW,
      decrement_step=1,
      min_value = 0,
      min_value_reached=self.__notify_monitor_usage)

  # The streamlined sim_loop method
  def _sim_loop(self, context: SimulationContext):
    while self.simulation_state is not SimulationState.ENDED:
      match self.simulation_state:
        case SimulationState.RUNNING:
          self._process_sim_cycle(context)
          # Decrement both counters.
          self._utility_sampler.decrement(frame_context = context)
          self.__monitor_hardware_counter.decrement()
        case SimulationState.STOPPED | SimulationState.INITIAL:
          self._wait_until_next_check()
        case _:
          raise Exception(f'SimLoop: Unknown SimulationState {self.simulation_state}')
Capturing Hardware Metrics#
With the easy part of just measuring the frame specific metics done, I had to find a way to collect the hardware metrics. This was a rather frustrating endeavour.
Specifically, I want real-time metrics of the CPU usage, memory, and GPU access being done by the Python process that runs a simulation in the Agents Playground engine. Not the entire OS.
I had early success with the psutil module. It provides a simple way to fetch the CPU and memory usage of a specific process.
import psutil
import os

ps = psutil.Process(os.getpid())

#Find the CPU utilization for the process.
cpu_info = ps.cpu_percent(interval=1)

# Find the memory usage for the process.
memory_info = ps.memory_full_info()
That said, after getting the basic metrics collection working I encountered two non-trivial issues.
Problem 1#
Psutil does it’s magic by leveraging lower level system functions that are platform specific. The underlying calls that power psutil on macOS can take a bit of time to complete and is inconsistent in how long it takes to run. I noticed this after I wired up the hardware metrics collection and I started seeing dropped frames in simulations.
The SimLoop’s main loop is tightly tuned. I don’t want to tolerate dropping frames because of the performance monitoring. It ironically defeats the purpose of monitoring.
I decided to completely remove the risk of the hardware monitoring slowing down things by putting it on it’s own dedicated process using the Python multiprocessing module.
The only thing interesting about having a separate dedicated process for collecting the hardware metrics is how the two processes communicate between each other.
When the subprocess spins up it returns the output connection of a one-way Pipe. The subprocess uses the pipe to share the collected metrics with the main process. The main process in turn issues the command to shut down by using a multiprocessing Event.
# Note: Some code excluded for clarity.
from multiprocessing import Event, Pipe, Process
from multiprocessing.connection import Connection
import traceback

class PerformanceMonitor:
  def __init__(self) -> None:
    self.__process: Process | None = None
    self.__stop = Event()

  def start(self, monitor_pid: int) -> Connection:
    """Starts the monitor subprocess.

    Args
      - monitor_pid: The process ID of the process that will be monitored.

    Returns
      The output connection of the process.
    """
    pipe_receive, pipe_send = Pipe(duplex=False)

    self.__process = Process(
      target=monitor,
      name='child-process',
      args=(monitor_pid, pipe_send, self.__stop),
      daemon=False
    )

    self.__process.start()
    return pipe_receive

  def stop(self) -> None:
    """Terminates the monitor process."""
    self.__stop.set()
    if self.__process is not None:
      self.__process.join()
      assert self.__process.exitcode == 0, f'Performance Monitor exit code not 0. It was {self.__process.exitcode}'
      self.__process.close()

def monitor(
  monitor_pid:int,
  output_pipe: Connection,
  stop: multiprocessing.synchronize.Event) -> None:
  """This is the subprocess's main function.
    It is responsible for taking the hardware samples.
  """
  try:
    while not stop.is_set():
      # collect all of the hardware metrics
      # skipping the boring bits...
      output_pipe.send(metrics)
      sleep(MONITOR_FREQUENCY)
    else:
      log('Asked to stop.')
  except BaseException as e:
    traceback.print_exception(e)
    sys.stdout.flush()
Honestly, having a child process to collect the metrics isn’t too painful. However, once I got the metrics collection process working I immediately ran into the second issue.
Problem 2#
When I originally wired up the hardware monitoring there was effectively one Python process monitoring itself. The situation changed after I migrated the monitoring code to it its own process. Now I have a process trying to monitor a different process. On macOS you’ve got to have root level permissions to do that. This makes me so very sad…
There may be a work around for this, but I haven’t been able to find one yet. As a half measure the code is dynamically checking who the user is and only collecting the metrics if they are root.
I created a decorator to handle guarding for root access. I think this helps keep the code clean.
from functools import wraps
import os
from typing import Any, Callable

def require_root(func) -> Callable:
  """ Only call the decorated function if the effective user is root."""
  @wraps(func)
  def wrapper(*args, **kargs) -> Any:
    result: Any = None
    if os.geteuid() == 0:
      result = func(*args, **kargs)
    return result
  return wrapper
Then I just add the decorator to the privileged methods.
class Simulation:
  # skipping so much stuff...

  @require_root
  def _start_perf_monitor(self):
    # Fire up the monitoring process...

  @require_root
  def _update_hardware_metrics(self) -> None:
    # update the various UI widgets
GPUs#
I can now monitor the top level CPU and memory consumption. Now I just need the GPU stats. From an off the shelf perspective I’ve only found active Python packages that can monitor Nvidia graphics cards. Since I’m using a variety of Mac laptops that all have embedded Intel GPUs that doesn’t help me.
I’ve exhausted my research budget on this one, so I’m moving on.
The User Experience#
With the metrics all being reliably collected, I now need a way for them to be displayed on screen.
For the moment I’ve gone with a panel that can be toggled on and off at the top of the simulation window. I have single number widgets for the hardware metrics which if you hover over them will display a tooltip with a description of the metric and a plot of how the metric has trended over the last 120 frames.
The frame level metrics are displayed using plots that take up the full width of the simulation window. I’m sure I’ll continue to tweak this, but you can see what it looks like at the moment in the below GIF.
Future Work#
I’m pretty happy with how things have turned out. It wasn’t too hard to get the basics of what I want out of in-app monitoring. That said, I know I’ll be making changes.
I’ll most likely continue to hack on the UI. I’d like to try out some different fonts, make a more responsive UI, and possibly swap out the simple plots for more complex ones. It’s fun to mess around plots. It would be fun to have different colors for the various plots. Maybe display a warning threshold on some of the plots to show where the allocations are.
At the moment the UI displays the time spent processing tasks and rendering on separate plots. I’d like to see it visualized as a stacked graph between running tasks, rendering, and waiting.
Finally, the budget is currently defined at the engine level. I’d like to have this be optionally specified per simulation. For example some simulations might need to run at 14 FPS or 24 or 30. The ability to watch a simulation run slower would be helpful in debugging.
But those are all problems for future Sam. At the moment, things are good enough to call this one done.
Until next time…
- Sam