GPU Tracing with Python
- 1056 words
- Estimated Reading Time: 5 minutes
I’m using Python with the Rust WebGPU implementation to build a small 3D engine on macOS. This is a lot of fun but has toolchain challenges. Namely, I’ve struggled to find a solution for debugging GPU activity.
On Windows and Linux there’s Pix and RenderDoc. On macOS the only option I’m aware of is the Metal GPU tools that ship with XCode. That’s not great.
First off, I’m not a fan of XCode. I prefer a text editor over IDEs and I find XCode to be overly complicated and confusing. Secondly, I couldn’t find guidance on how to leverage XCode with a Python application. The few tutorials I could find are out of date and didn’t work for the latest version of XCode. Even then, they all require setting up an XCode project. I don’t want that. I want to stay in my happy little text editor and not have to separately maintain an XCode project.
What I really want is the ability to visualize the data passed to the GPU and have the ability to step through the execution of WGSL shaders.
After a lot of research and trial and error I came up with a solution for programmatically capturing Metal GPU traces of my running engine. I haven’t seen anyone else do this in Python so I think it’s worth sharing.
Why is this Useful?#
Python can be debugged using pdb or an integrated debugger. These tools are designed to work on the CPU and don’t help with debugging GPU workloads.
In order to inspect work being done by the GPU, a trace needs to be captured. The trace is basically a record of everything the GPU did. The trace can be used after the fact to step through the GPU actions.
This is highly useful for trying to understand why a shader isn’t working or optimizing buffer packing.
What doesn’t this do?#
WebGPU provides its own shader language, WGSL, which is transpiled into a native shading language. On macOS, the default is WGSL shaders are transpiled into Metal MSL shaders.
My approach enables stepping through the generated Metal shaders. This is useful because I do want to understand what is actually being run by the GPU.
I’m happy that this solution provides this ability but I still want a solution to step through the WGSL shaders as they’re written.
Capturing a Metal GPU Trace#
As I mentioned in the introduction, I’m using WebGPU for the low level graphics. WebGPU acts as a bit of a hardware abstraction layer. It produces the appropriate shaders for the underlying hardware. On macOS, the native backend is Metal. With this in mind, I pursued capturing a Metal GPU trace.
Turns out, Apple provides the ability to do this via their Metal SDK. Unfortunately, the SDK is in Objective-C.
Lucky for me there are Python bindings. The PyObjc project includes a Python wrapper for Metal framework which is the secret sauce in my solution.
GPU Trace Capture Recipe#
There are three steps for capturing a GPU Metal Trace.
- The MTL_CAPTURE_ENABLED environment variable must be set to 1.
- A MTLCaptureDescriptor instance must be configured to specify how to make the trace and where to store it.
- A Metal MTLCaptureManager instance is used to start and end the trace.
All in all that seems straightforward. Here is how to do it in Python.
For step 1, the MTL_CAPTURE_ENABLED is set to the value of 1. This signals to the Metal framework that tracing is enabled. According to the Metal documentation provided by Apple there is a slight CPU performance penalty when this is turned on.
In Python we can do this with the os package.
import os
os.environ["MTL_CAPTURE_ENABLED"] = "1"
For steps two and three, the PyObjc packages Foundation and Metal provide the tools to capture the trace.
# Import the relevant PyObjc Objective-C bindings.
import Foundation
import Metal

# Specify where the trace file should be saved.
# This is just an example. I recommend putting the starting and ending frame numbers in the file name.
trace_file = os.path.join(Path.cwd(), "gpu_traces", "my_gpu_trace.gputrace")
get_logger().info(f"Attempting to write a GPU trace file to {trace_file}")
trace_file_path = Foundation.NSURL.alloc().initFileURLWithPath_(trace_file)

# Configure how the trace should be captured.
capture_descriptor = Metal.MTLCaptureDescriptor()
capture_descriptor.setDestination_(Metal.MTLCaptureDestinationGPUTraceDocument)
capture_descriptor.setOutputURL_(trace_file_path)

# Determine which device to capture.
metal_device = Metal.MTLCreateSystemDefaultDevice()
capture_descriptor.setCaptureObject_(metal_device)

# Get the Metal Capture Manager and start the capture.
metal_manager = Metal.MTLCaptureManager.sharedCaptureManager()
response = metal_manager.startCaptureWithDescriptor_error_(capture_descriptor, None)

# Make all of the WebGPU calls
# Note that this can be across multiple frames if desired.

# Stop the trace.
metal_manager.stopCapture()
That’s it. It’s easy when you know the solution.
Engine Integration#
For the sake of completeness, here is how I incorporated this solution into my project.
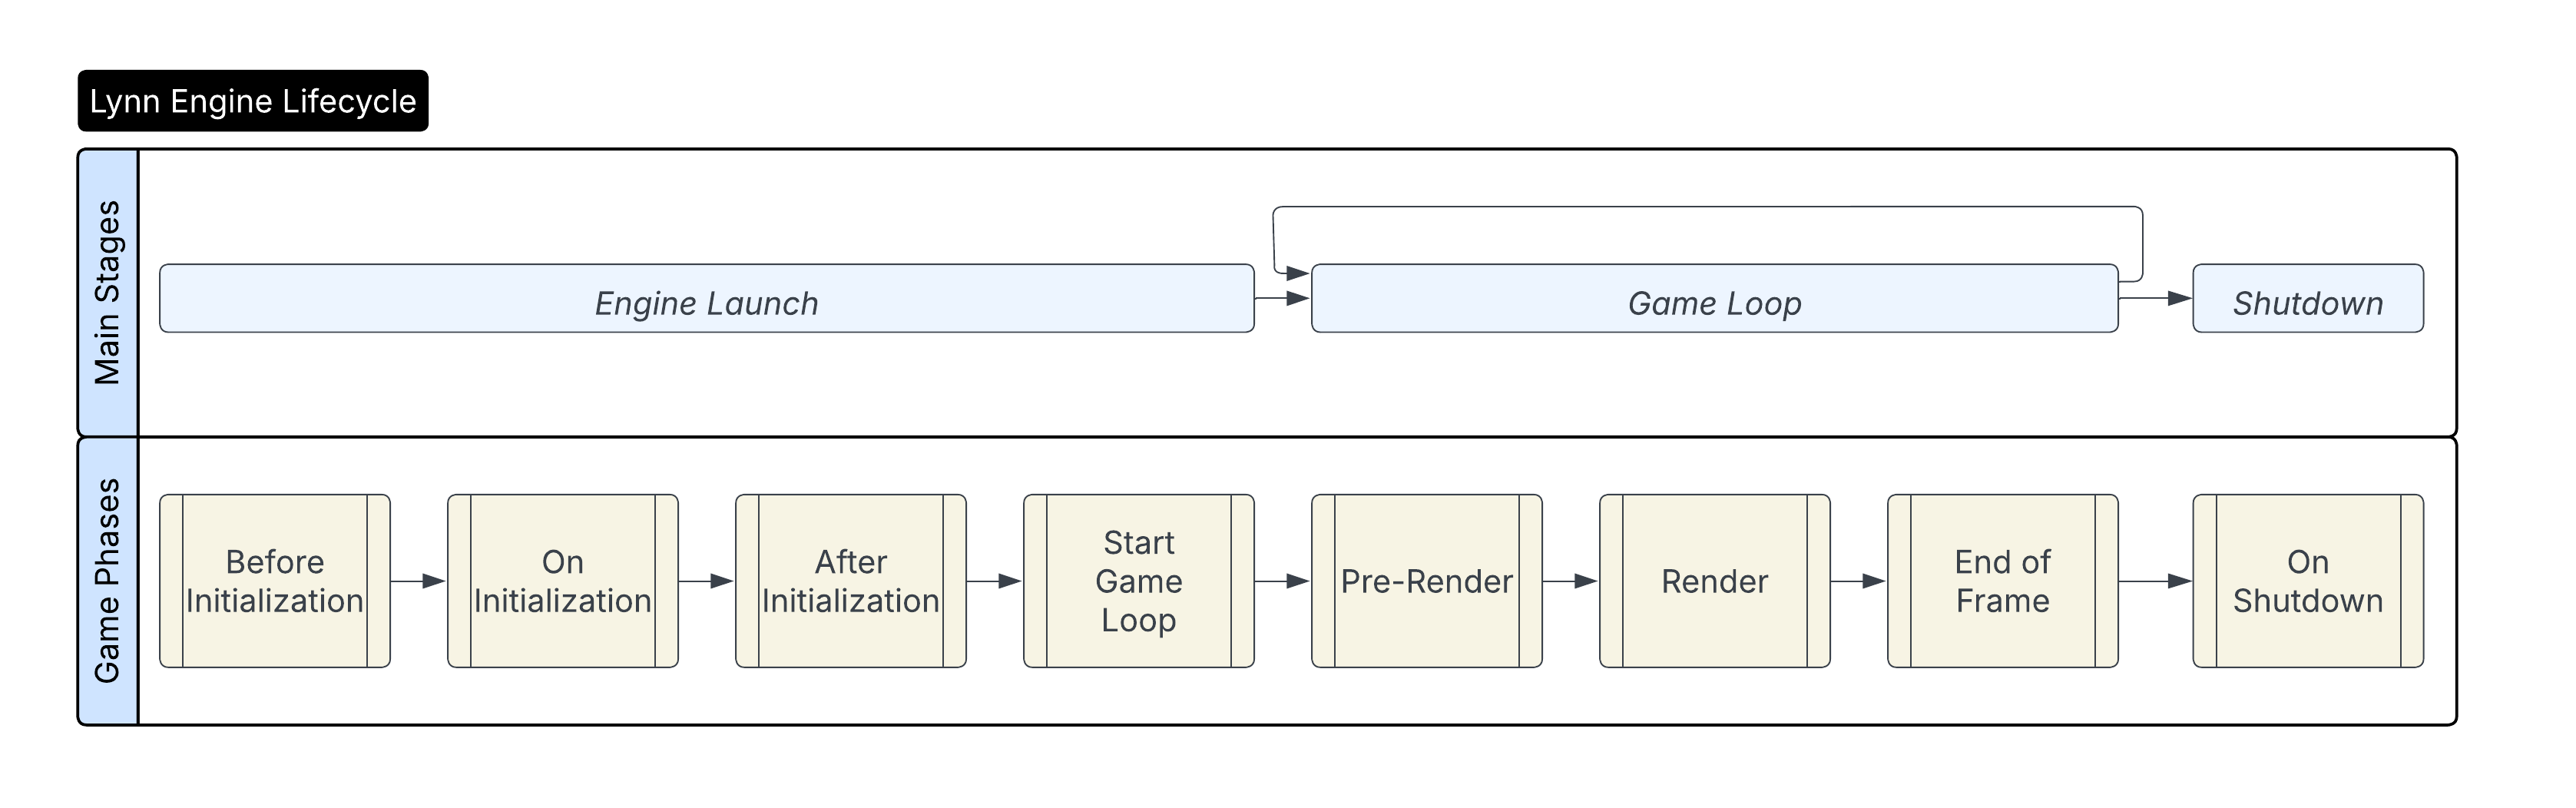
My engine (called Lynn) has 3 high level stages that run after the
engine is bootstrapped. The stages are further subdivided
into 8 distinct phases in its runtime lifecycle.
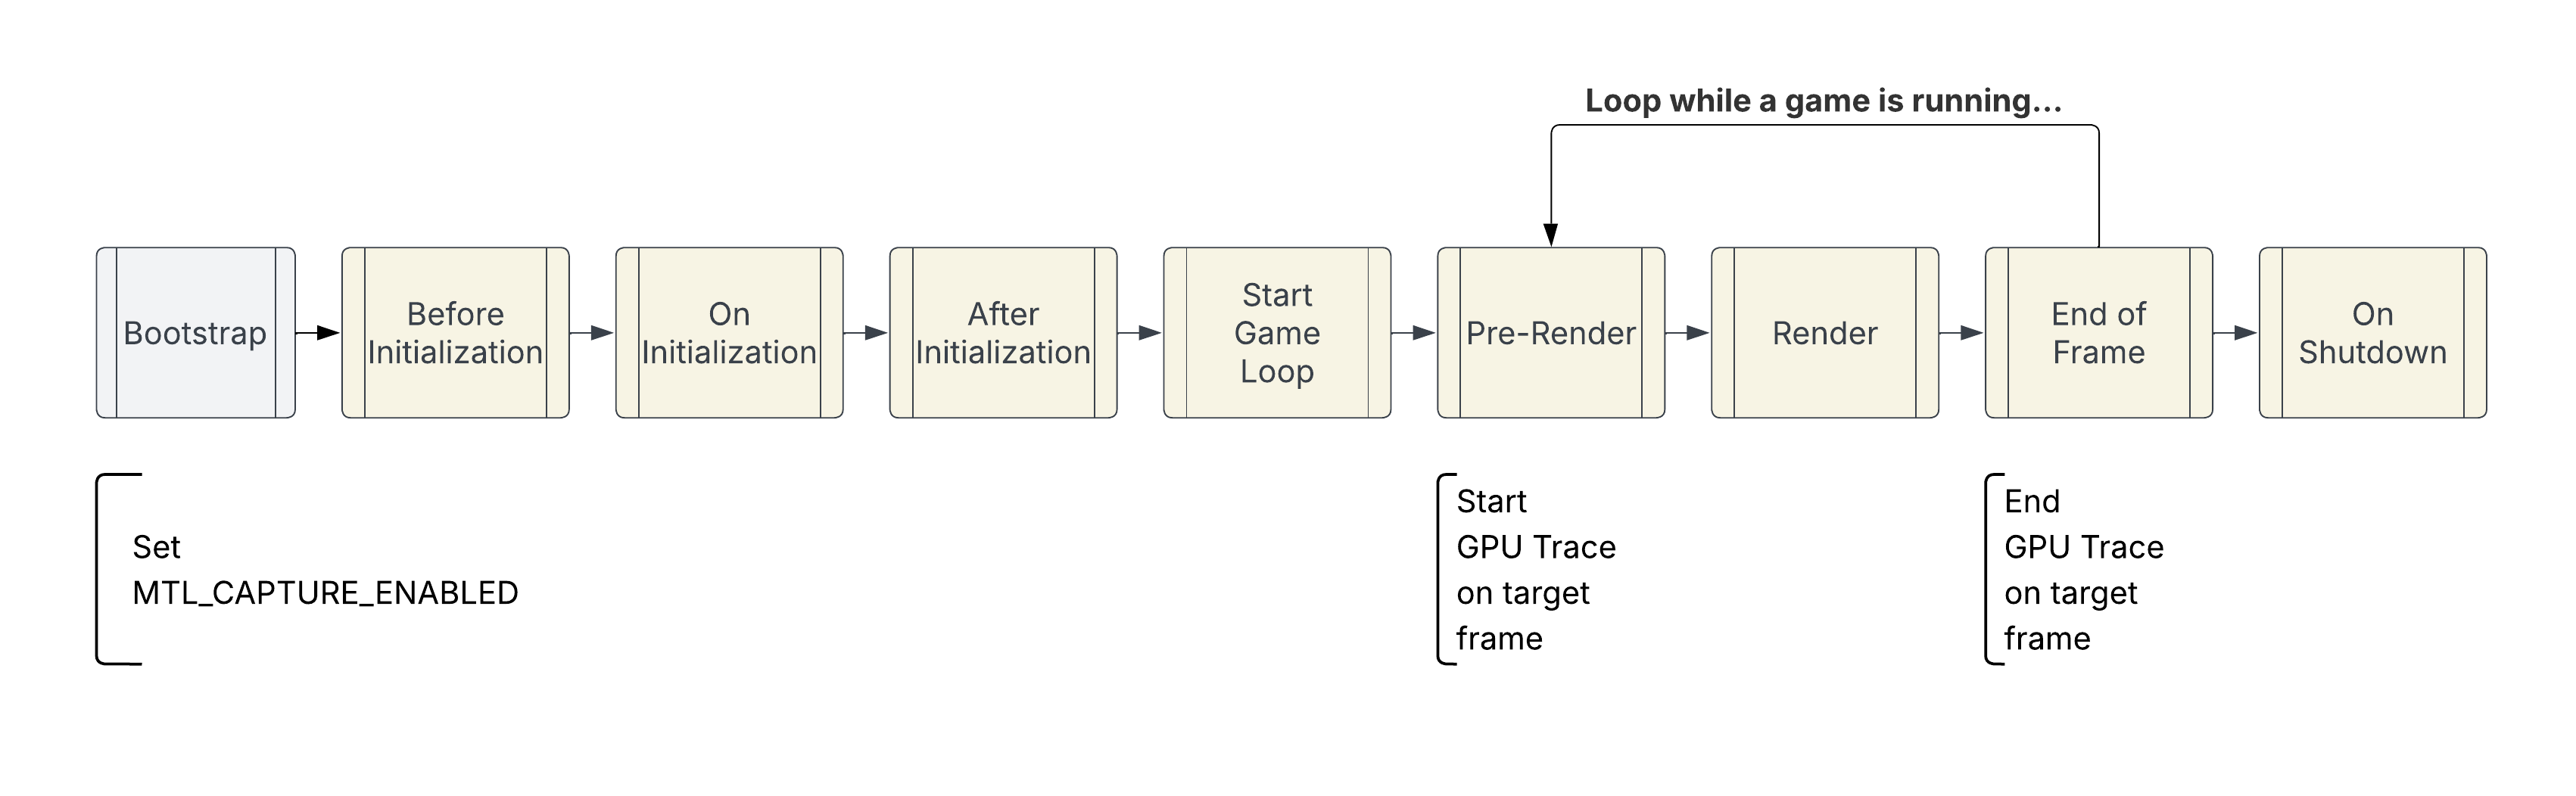
After some experimentation I decided to set the MTL_CAPTURE_ENABLED environment variable in the bootstrapping process that runs before the engine really gets going.
The start and end of the trace occurs during the pre-render and end of frame_ phases.
I want enabling a trace to be as straight forward as possible. To that end, I made the implementation driven by both a settings.json file and by command line options. The command line options override the settings file.
The below snippet demonstrates how the engine can be run with a trace captured for frames 2 through 4.
lynn --enable_gpu_tracing=1 \
    --gpu_trace_start_frame=2 \
    --gpu_trace_end_frame=4 \
    --gpu_trace_output_directory=./gpu_traces \
    ~/Documents/my_game
What to do with a Trace File#
Once a Metal GPU trace file has been captured it can be opened with XCode and interacted with using the Metal Shader Debugger. That process is documented by Apple.
Wrapping Up#
There you go. This is my strategy for capturing a GPU trace on macOS. It is currently very platform specific as I’m only working on macOS at the moment.
For future work, I intend to have a hardware abstraction layer that will encapsulate this sort of thing. Additionally, my solution assumes there is just one device on the computer running the engine. It would be better if I could specify the device to use from the WebGPU components at play. That however is a challenge for future Sam.
Until next time…
- Sam